Data visualization
 
															 
															Best Data visualization Services
At 9bloom, we specialize in turning complex datasets into clear, compelling visual stories that drive business success. With years of expertise in data services, we understand that raw data alone is not enough—visualization is key to unlocking its true potential.
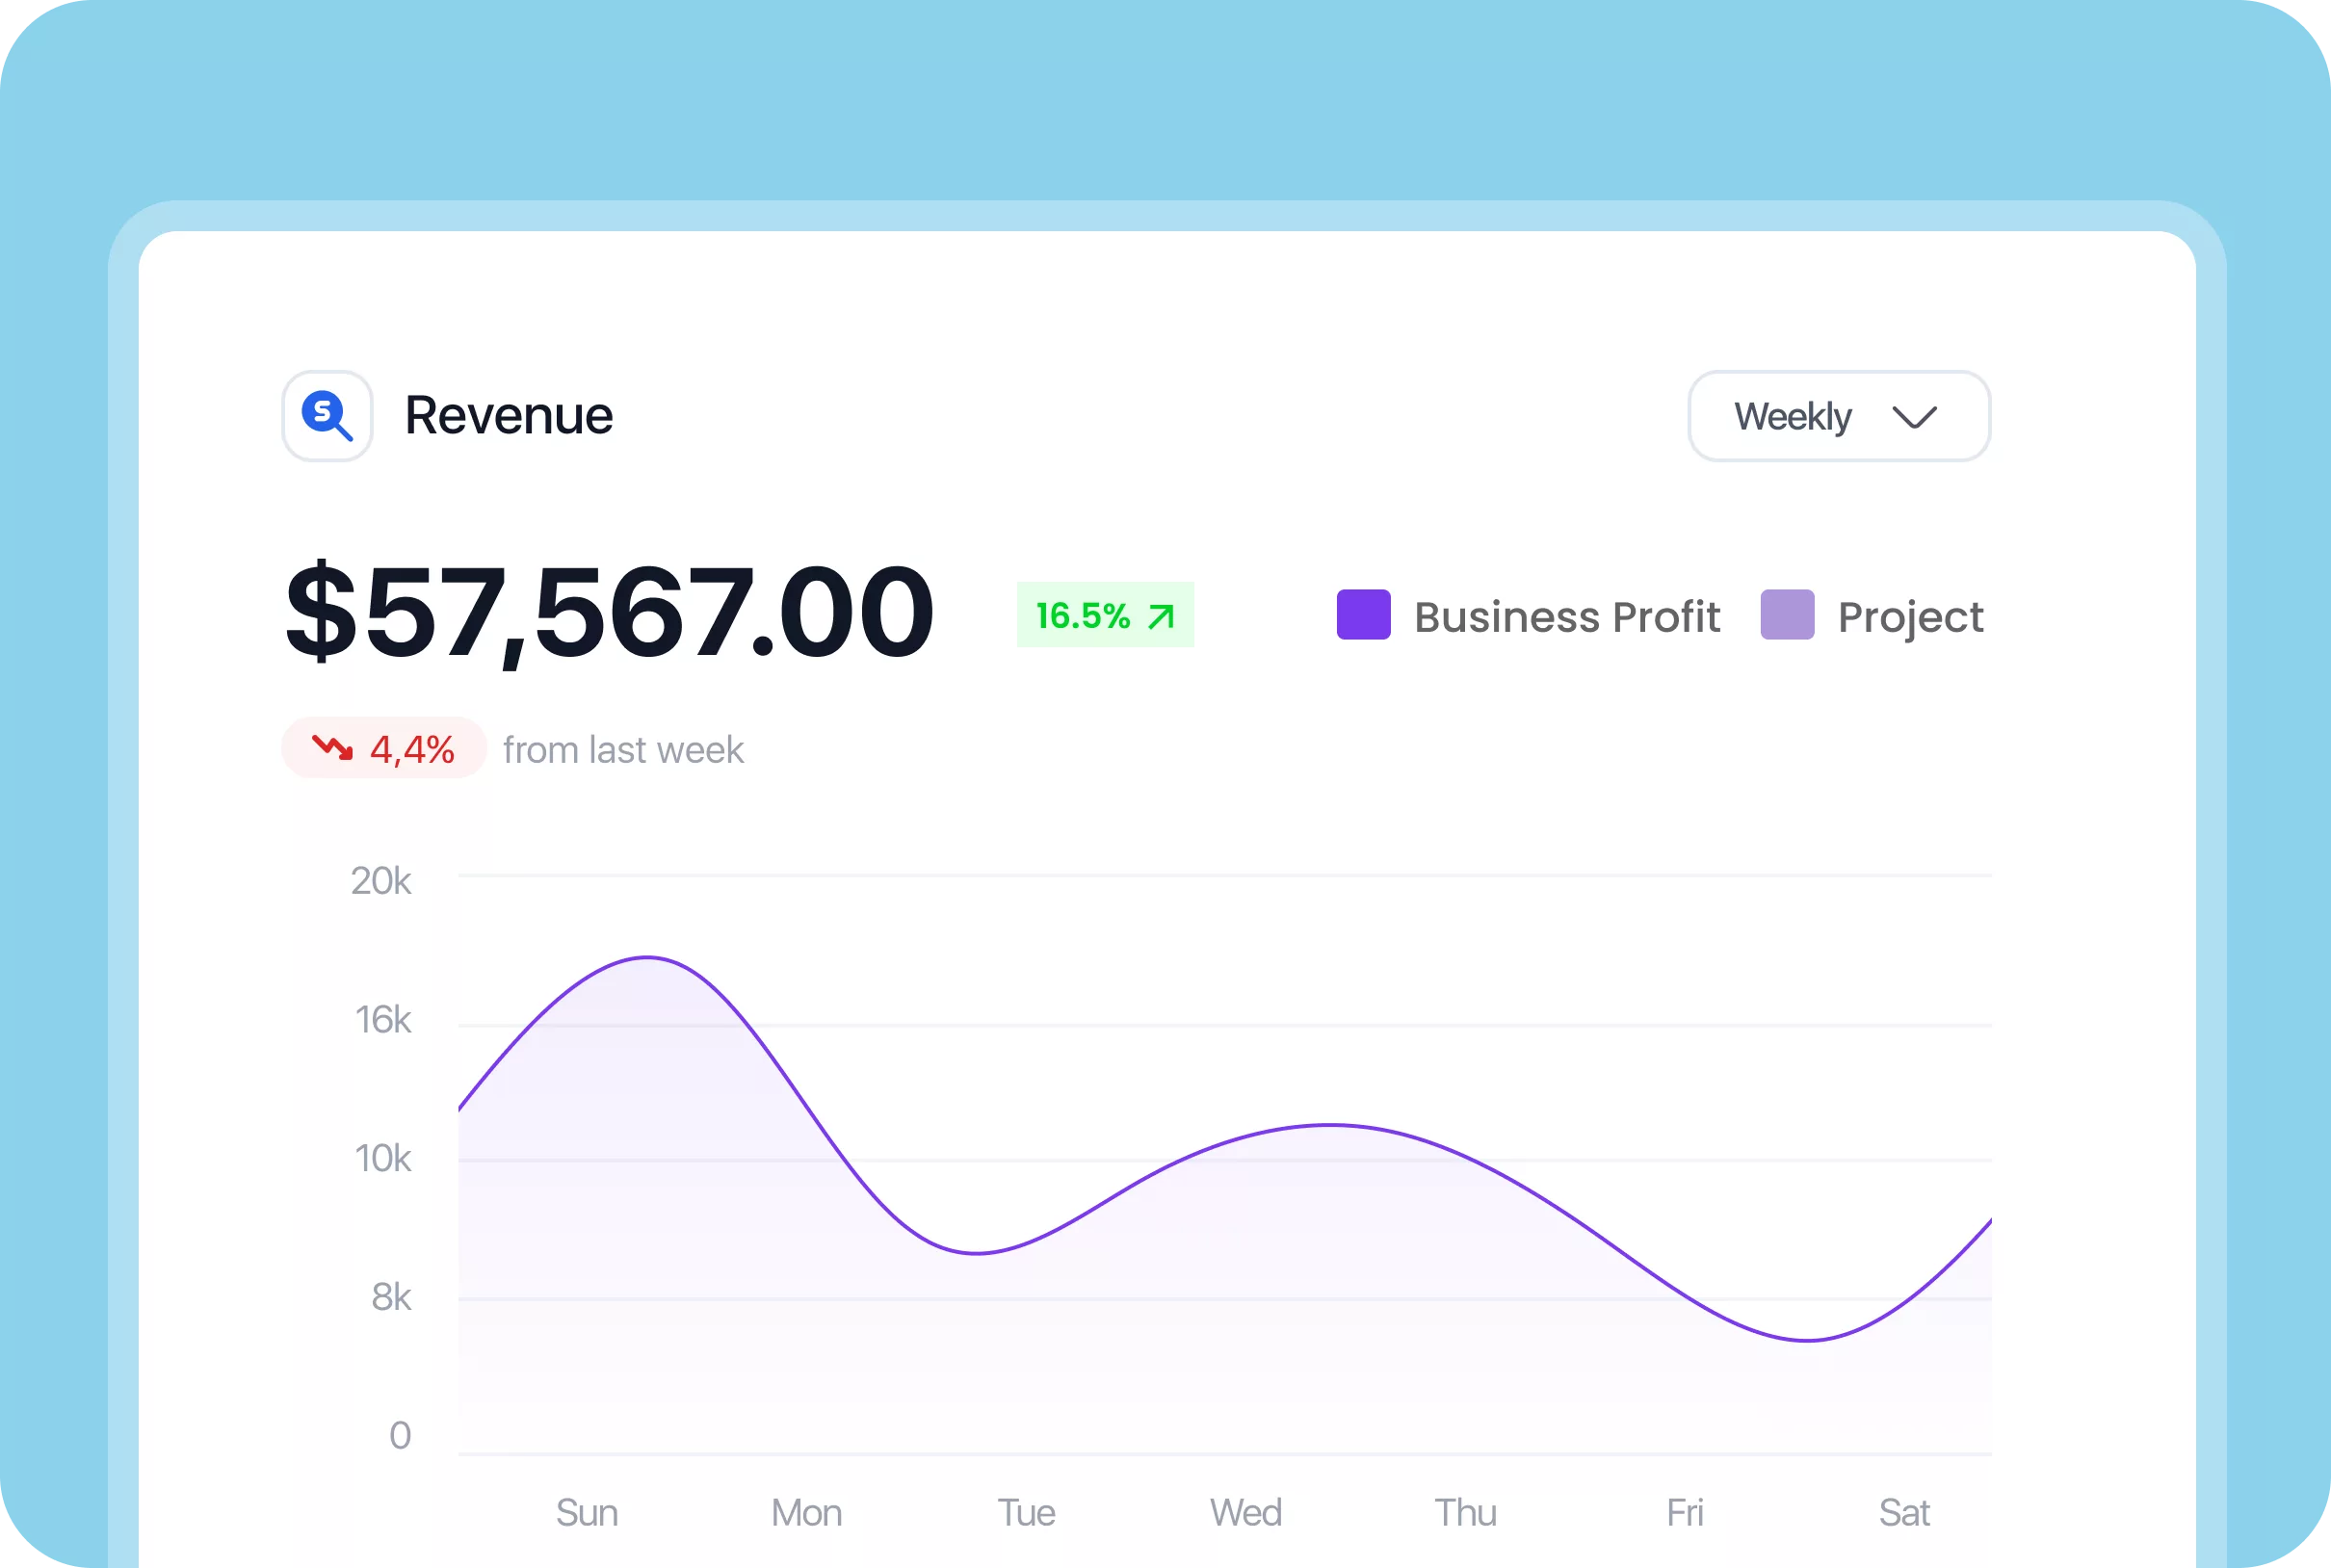
Our data visualization solutions help businesses make faster, smarter decisions through intuitive dashboards, real-time reporting, and strategic monitoring tools.
Whether you’re tracking KPIs, analyzing customer behavior, or measuring campaign performance, our tools are tailored to give you the clarity you need.
Ready to transform your data into decisions? Contact us today!
 
															Why data visualization is essential for businesses
In today’s data-driven world, visual representation makes all the difference. Spreadsheets and raw reports can be overwhelming—but dynamic visuals simplify and highlight what matters most.
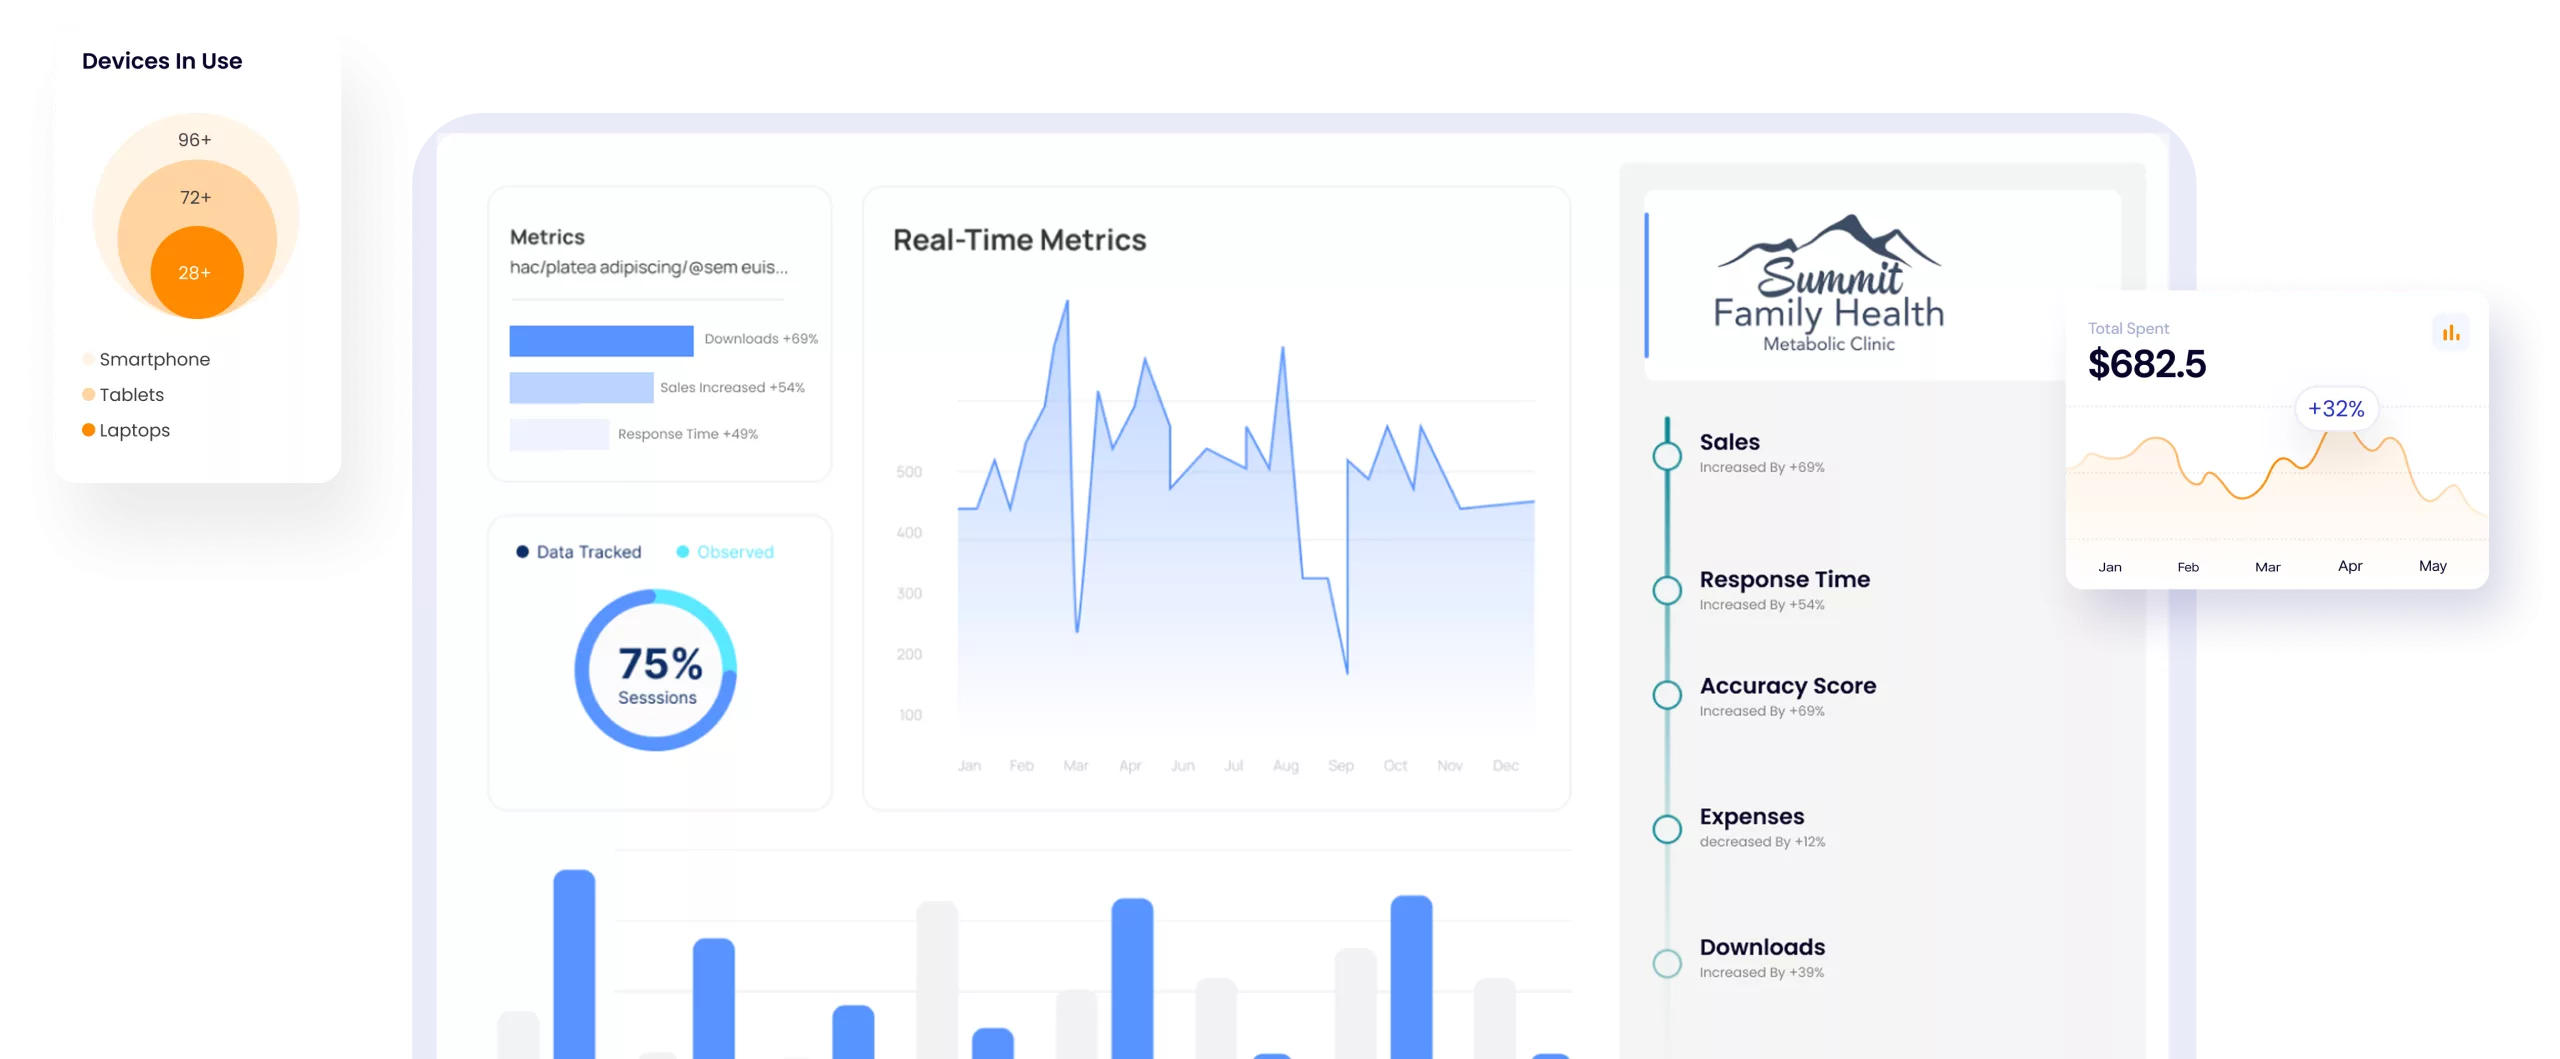
Spot trends and patterns instantly with intuitive graphs and charts.
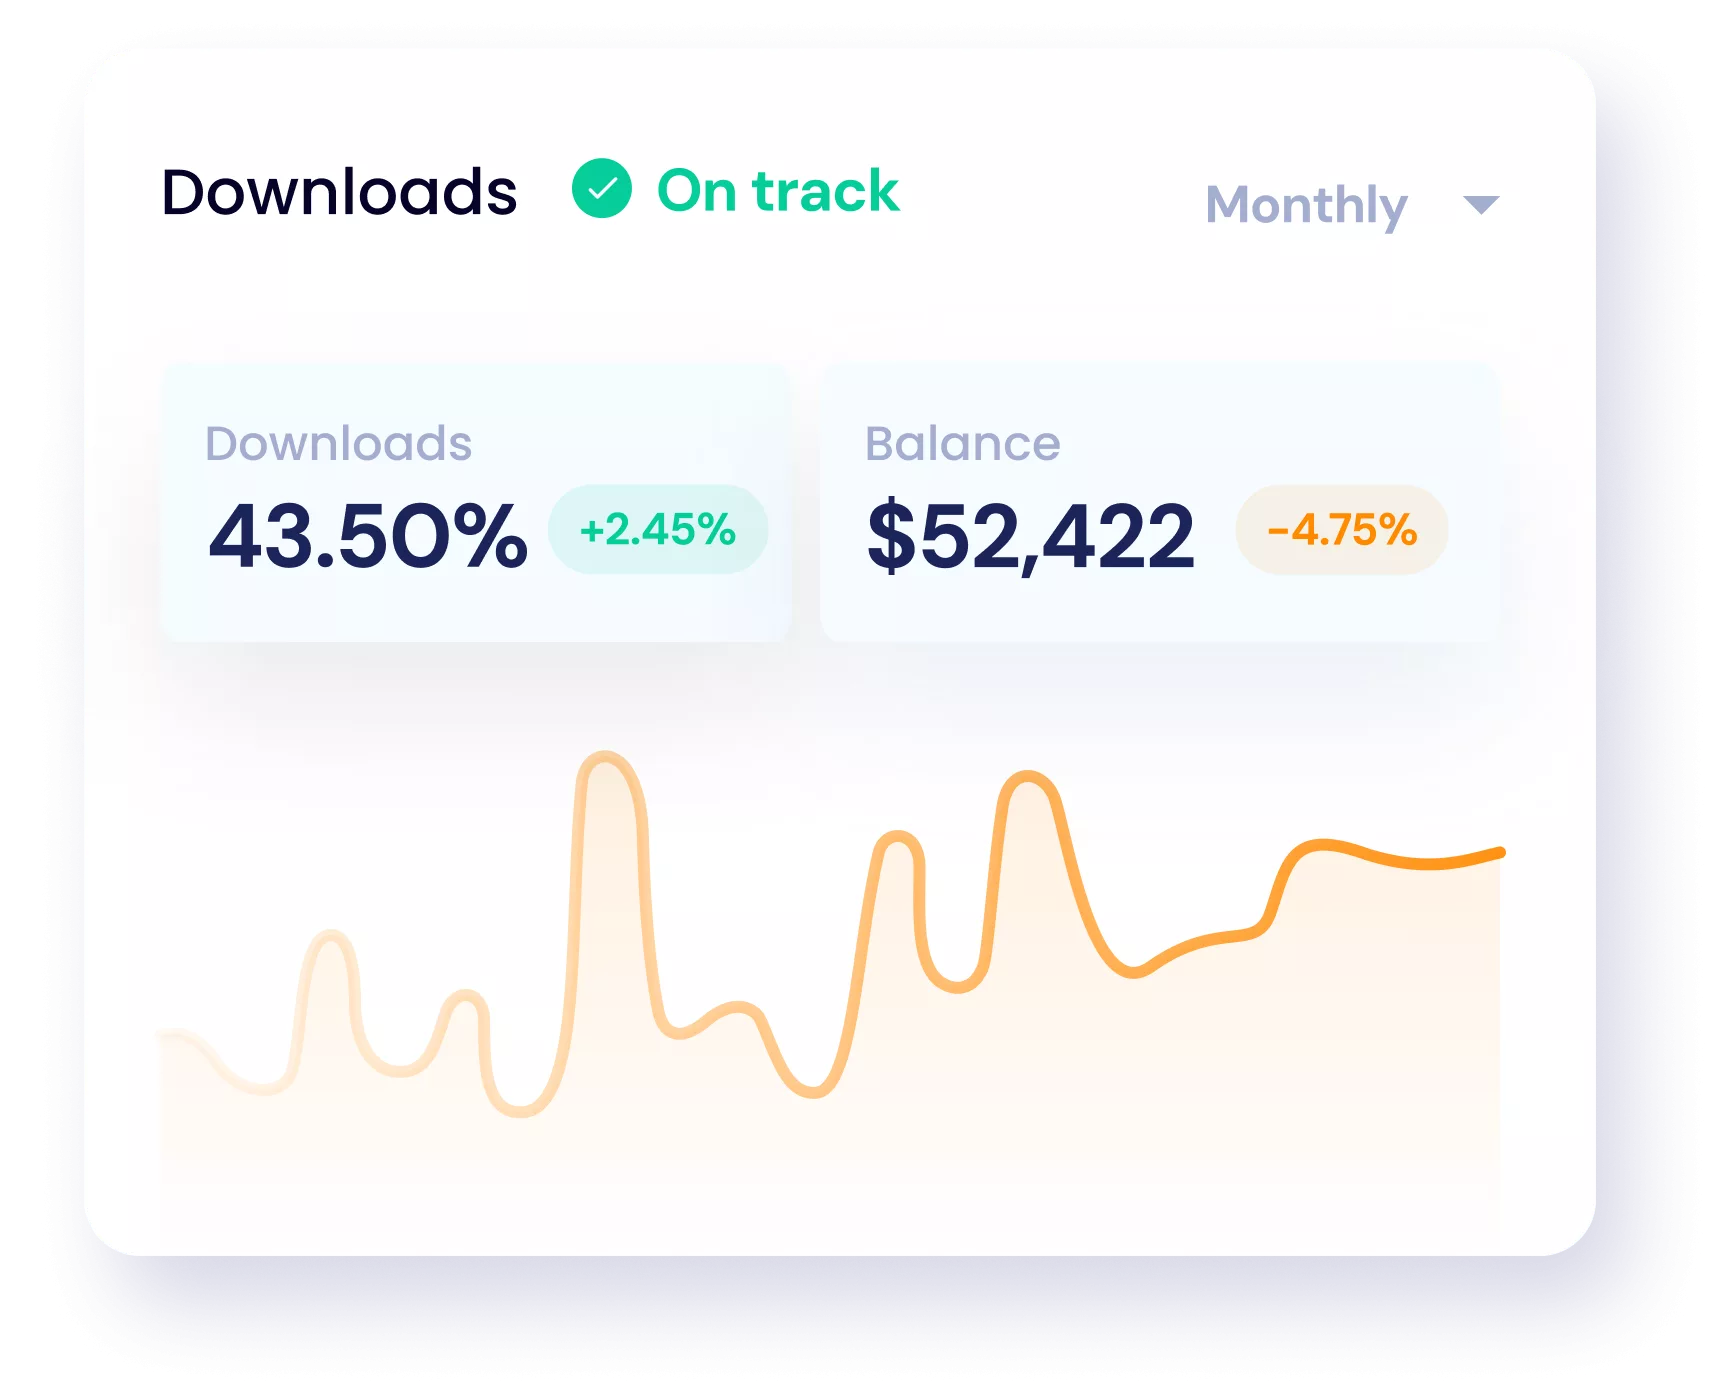
Real-time dashboards enable faster responses and proactive planning.


															Vaughn Analytics
Vaughn Analytics, a retail client, used 9bloom’s custom dashboard to increase sales by 23% in just one quarter, simply by visualizing regional buying trends and reallocating marketing spend.
With effective visualization, your business can move from information overload to insightful action—fast.
Our data visualization services
Customized dashboards to track sales, conversions, and business KPIs
We build interactive, user-friendly dashboards that give your teams
complete visibility into your operations.
- Monitor sales, customer engagement, and marketing ROI in real time.
- Dashboards customized by role or department.
- Seamlessly integrates with CRM systems, analytics tools, databases, and more.
 
															Reports about key progress
Keep stakeholders aligned with automated and visually rich reports.
- Clear breakdowns of key metrics, trends, and forecasts.
- Infographics, pie charts, line graphs, and more to tell your data’s story effectively.
Our team ensures the data gathered aligns with your specific goals
and KPIs, so your team can focus on making data-backed decisions.
 
															End-to-end monitoring of key processes
Gain continuous insight into what’s happening across your business.
- Track project milestones, workflows, and key operations.
- Spot inefficiencies and optimize in real time.
- Cross-platform data integration for full visibility.
 
															Triggers and alerts to respond early and quickly to interruptions and issues
Stay proactive with real-time notifications and intelligent alert systems.
- Custom triggers for sales drops, system issues, or performance dips.
- Rule-based workflows for automated decision support.
- Alerts via email, SMS, or directly in your dashboard.
 
															 
															Why choose 9bloom for data visualization?
Here’s why businesses choose 9bloom as their trusted data visualization partner:
Advanced tools
We use leading platforms like Power BI, Tableau, and Looker.
Seamless integration
Works with your current tech stack, CRM, and apps.
Data into insights
We focus on actionable outcomes—not just pretty visuals.
Client success stories
We’ve helped companies across industries grow faster through smart data visualization.